(2 min read)
Analytics Dashboards are useful for providing a quick snapshot of performance at any moment that you need it. You can easily create fully customizable dashboards for your fundraising, engagement, and organizing campaigns. You can also share these dashboards across your organization.
Default dashboards
There are a number of default dashboards you can use or can customize to your needs.
The Contributions Dashboard includes all contact records that have contributed This Year to Date and displays:
- Fundraising Performance
- Total Contribution Amounts by Month
- Donor Housefile Summary
- Contributions by Origin Code
- One-Time vs. Recurring Contribution Information
- Recurring Commitment Performance
- Recurring Commitment Processing Success Rate by Month
The Email Performance Dashboard will cover emails sent to all contact records This Quarter and shows:
- Top 10 Emails for Amount Raised
- Top 10 Emails for Conversions
- Open Rate per Email
- Click Rate per Email
- Bounce Rate per Email
- Unsubscribe Rate per Email
- Emails Sent per Week
- Recipients per Week
The Online Activity Dashboard covers Online Activity for all contact records that have filled out a form This Year to Date. It includes:
- Online Activity Summary
- Form Submissions per Month
- Top 10 Forms for New Contacts
- New Contacts per Month
- Top 10 Origin Codes for New Contacts
- Top Forms for Submissions
- Top 10 Forms for Amount Raised
- Amount Raised per Month
- Form Submissions per State
Creating an analytics dashboard
Search for Analytics Dashboards in the Sidebar or use the links available in Main Menu > Reporting & Data Analysis or Report Manager > Go to Analytics Dashboards.
Select the type of dashboard you wish to create. You will see several pre-built dashboards, including: Advocacy, Contributions, Email Performance, Online Activity, and Organizing. You can also create any new dashboards based our your organization's needs.
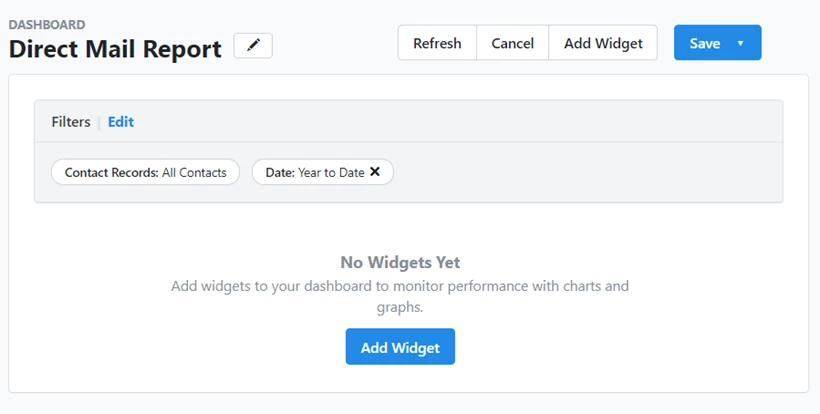
To create a new dashboard, select Create New Dashboard in the upper right-hand corner. A pop-up will open, allowing you to name the new dashboard and add a description. From the next screen, select Add Widget. 
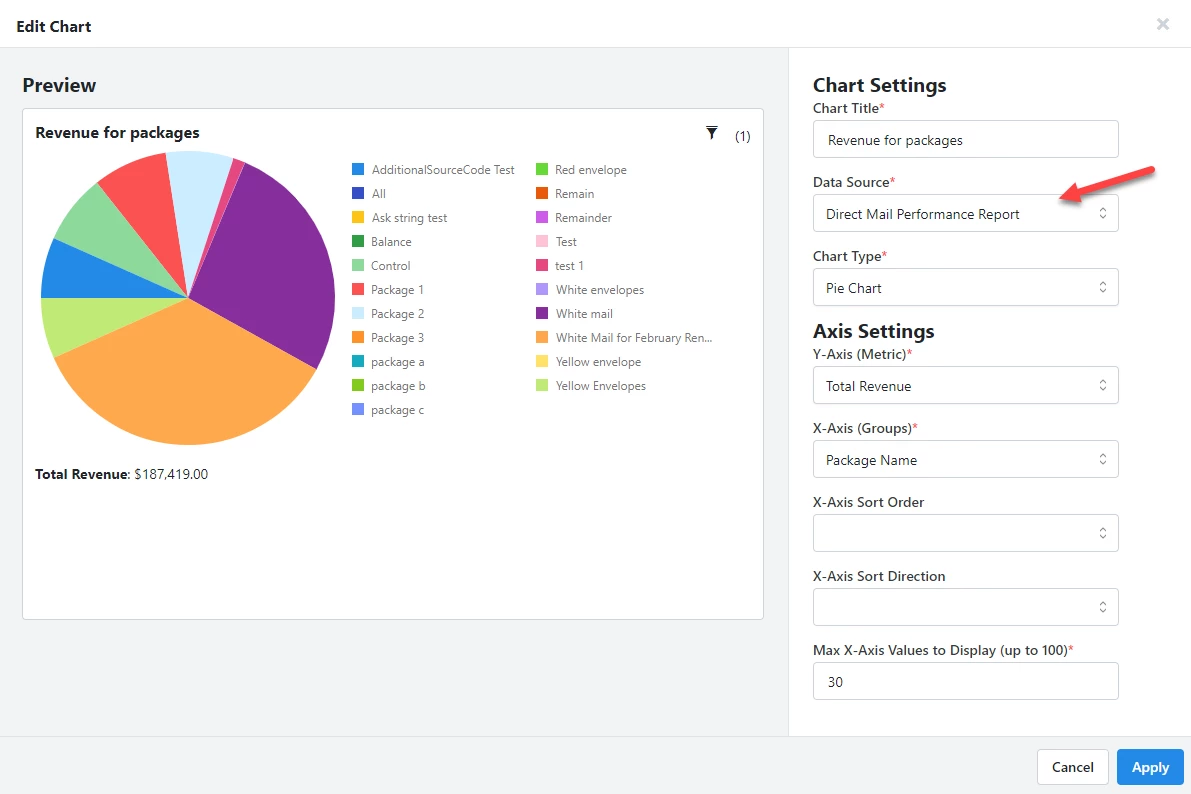
Analytics Dashboards are powered by grid reports. Choose the Data Source (Report), what type of Chart you wish to create, and then select your X and Y-Axis based on the information you wish to report on. When you are finished creating that widget press Add and the widget will be added to the dashboard.
Please note that the field "Data Source" is pulling from the pre-populated reports. 
Deleting Widgets
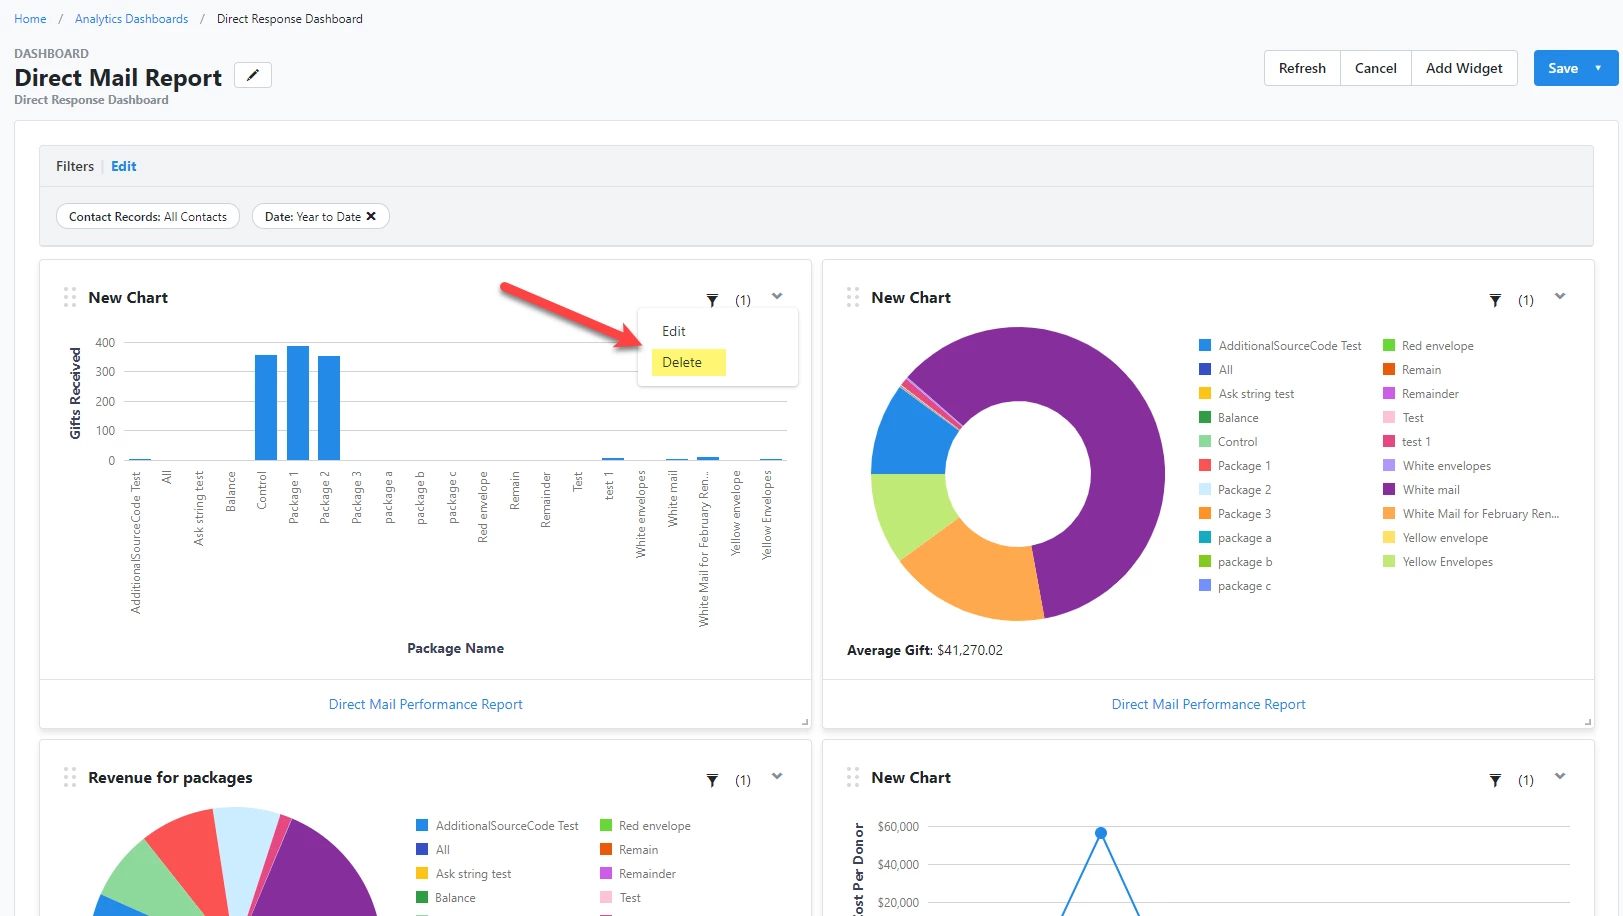
To delete a widget, select the down arrow on the widget you wish to delete and select the delete button. 
Looking for training?
Explore this feature at your own pace - join a live training session or watch a recorded webinar by clicking the link below.

