

Attention: EveryAction Development is now Bonterra Development. Please bear with us as we update our screenshots to match our new name.
(5 min read)
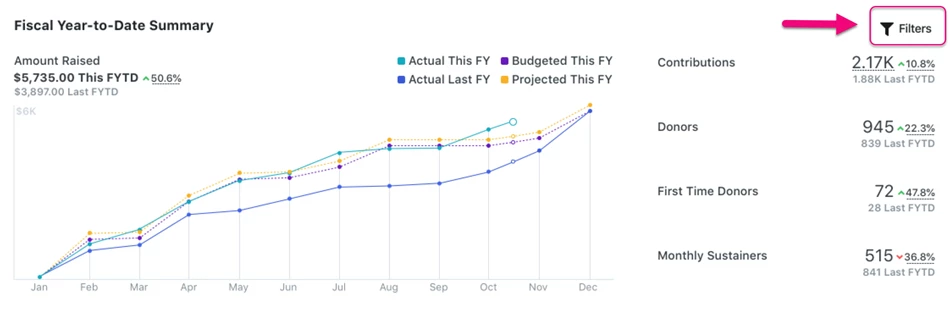
You can use the Fundraising Management dashboard and the Budget to Actuals Report to easily see how your projected budget compares with your actual fundraising results using Revenue Streams.
Read an overview of Revenue Streams
You will first need to set up your Revenue Streams, add your fundraising Budget, and then apply them to Contributions and Pledges via Source Codes.
Read more on how to set up Revenue Streams
Using the Fundraising Management dashboard
Once you’ve added your Revenue Streams, you can use the Filter on the Fundraising Management dashboard to select what you’d like to see in your Summary chart.
From the Revenue Streams section, adjust the filters under each Type to focus on the just the streams you want to see.
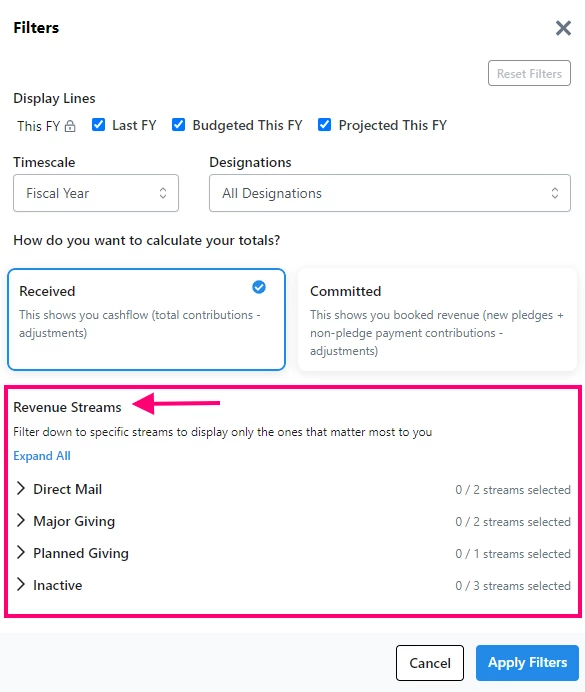
The other filters allow you to further refine your view:
-
Display Lines - Activates or deactivates the Budgeted, Projected, or Last FY comparison lines
-
Timescale - Let’s you view data based on Fiscal Year, Month, Quarter, or calendar Year
-
Designation - Displays data from the selected Designation or from a combination of all of them
-
Received - Shows your data based on the cash accounting method with the total received contributions or adjustments
-
Committed - Displays your data based on the accrual method, which includes committed Pledges
If you would like to share these filtered performance statistics with others, you can use our Revenue Streams Budget to Actual Report and use the same filters you use on your dashboard.
Using the Budget to Actuals Report
The Revenue Stream Budget to Actuals Report helps you compare the actual money raised in each Revenue Stream to your budget or current projections.
When you open the report from the Report Manager, you will be presented with choices for the settings of the report.
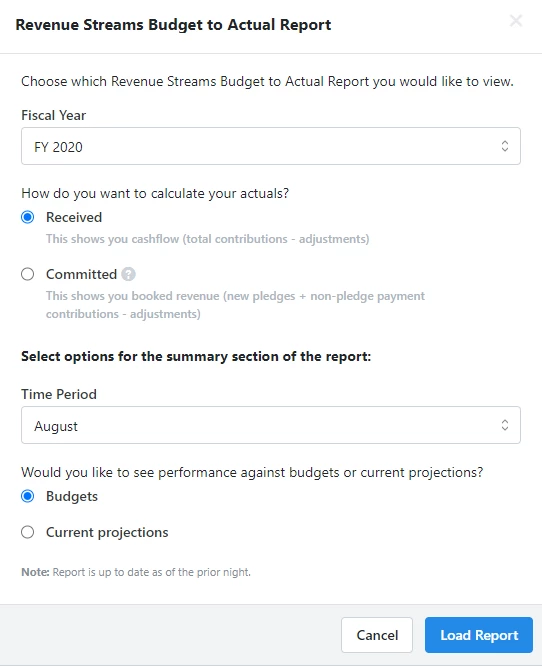
You will be asked to select:
-
Fiscal Year
The year you choose will be This Fiscal Year in the report and the previous year will be Last Fiscal Year.
-
Received or Committed actuals
This setting determines the calculation for the actuals columns in the report.
Received is the default setting. It calculates actuals based on your cashflow, summing the Remaining Amount of all Contributions.
Committed calculates actuals using the accrual accounting method. This includes Pledges where the Type is To Give, the Commitment Level is Promise, and Conditions is set to Unconditional as well as the sum of Remaining Amounts for Contributions that are not payments for Pledges with the above definition.
-
Time Period
This setting determines which range of time is used to calculate Summary numbers for the report. The choices are Fiscal Year, specific Months, or specific calendar Quarters. Totals for all time periods are available as columns in the report regardless of the time period selected here.
-
Performance measurement
You can select whether you want to compare actuals to Budgets or your Current Projections in the Summary bar of the report.
Once the report opens, the Summary will display time period totals, fiscal year to date totals, and comparisons with the previous year (what you see will depend on the settings you choose). You will also see a row for every Revenue Stream along with performance data for that particular stream.
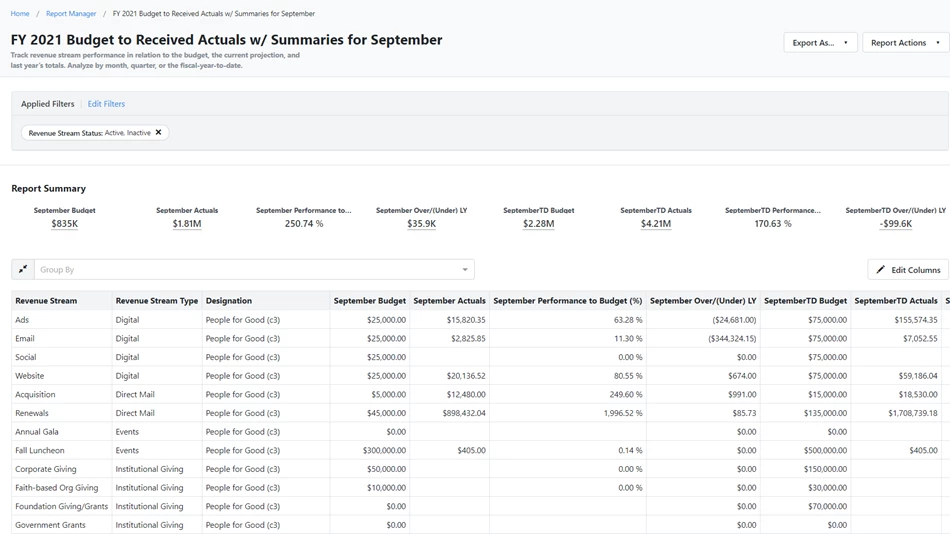
This report can be customized, exported, and scheduled the same way as our other reports. We have included some examples below of some helpful configurations for your report.
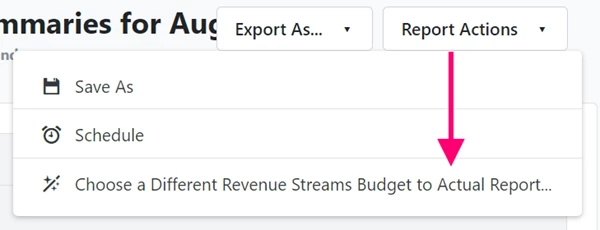
You can easily go back and change the main filters on the report by selecting Report Actions > Choose a Different Revenue Streams Budget to Actual Report.
Example: Monthly Performance Report
You can customize a report that you can run at the beginning of each month to show you the performance from the previous month.
In this example, we are going to set up a report for the month of March 2021 for an organization that receives Pledges. We want to see how we are doing against our yearly budget (not our projections).
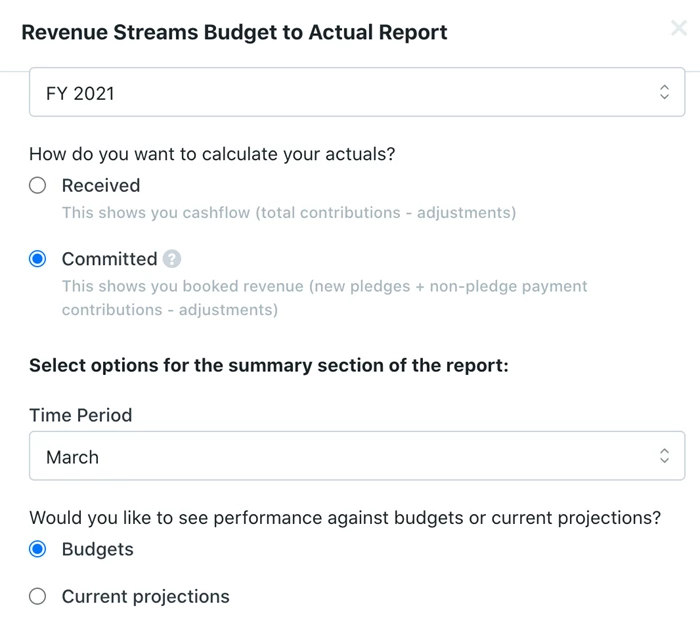
Use these report settings:
-
Select the current Fiscal Year (2021)
-
Select Committed (to include our Pledges)
-
Select March
-
Select Budgets (since we want to compare our performance to our original budget)
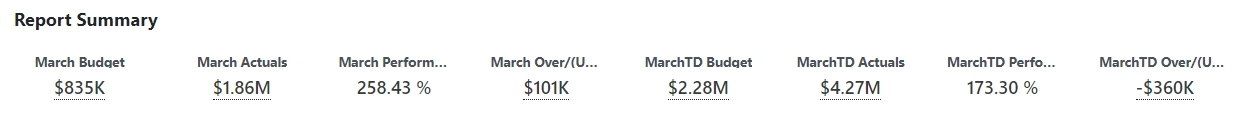
When you run the report, your Summary will display your performance during March as well as your performance for the full fiscal year through the end of March (FYTD) using four measurements:
-
Total Budget
-
Total Actuals
-
Performance to Budget (a percentage)
-
Over/(Under) last year
The default columns in the report will be the same as those in the Summary. Additional columns can be added to show more granular details for the month. Suggested columns include:
-
March Total Contributions - this will display the total of all contributions with a date received of March, regardless of whether or not they are Pledge payments. This allows you to display cash flow even though the report primarily shows accrual totals.
-
March Pledge Write-offs - Write-offs are not subtracted from Actual Raised totals, as they generally occur at a significantly later time than the initial Pledge and are not part of the performance calculation. But you may still want to include the write-offs made during the month in your Budget to Actual reports.
Example: Yearly Running Performance
Another common way to use this report is to include data from all months in the report as well as some total fiscal year comparisons. For this report, you will choose the Fiscal Year time period rather than a particular month.
One advantage of this second version is that the Summary will include totals through the previous day.
To create this report, use these report settings:
-
Choose the Fiscal Year time period setting.
-
If you use Pledges, select Committed to count the Pledges when they are made.
-
When you select Fiscal Year, both the Budget and Projections numbers appear in the Summary.
When you run the report you will see Summary performance across the Fiscal Year for:
-
Actual Raised
-
Over/Under Last year on this date
-
Total Budget
-
Total Projection
-
Total Raised Last Year
You can then customize the report by picking two to four value or comparison columns and adding them for each month of the year.
You may also want to add some additional full-year comparison columns:
-
FY Progress Towards Budget (%) shows the percent raised of the total budgeted. It’s sort of like a thermometer value for the Revenue Stream.
-
FY Budgeted Left to Raise shows the total budgeted amount that still needs to be raised.
-
You may also want to add the Total Contributions and/or Write-Offs for the year to supplement the accrued totals represented in the Actuals columns.
How do I how to: track fundraising success with revenue streams? | How does how to: track fundraising success with revenue streams work in EveryAction? | Why can't I how to: track fundraising success with revenue streams? | Where do I how to: track fundraising success with revenue streams in EveryAction? | What is how to: track fundraising success with revenue streams in EveryAction? | How to how to: track fundraising success with revenue streams? | Can I how to: track fundraising success with revenue streams in EveryAction?