

Attention: EveryAction Development is now Bonterra Development. Please bear with us as we update our screenshots to match our new name.
(4 min read)
The Fundraising Optimization Guide is designed to help you better understand your active donor file by using key fundraising metrics to track your historical performance and predict your future growth. If you also have DonorTrends predictive analytics, you will get straightforward action steps for optimizing your performance.
The guide contains five pages that focus on different opportunities for fundraising optimization:
- Increase Retention
- Upgrade donors
- Grow your sustainer program
- Reactivate lapsed donors
- Identify planned givers
The options you see will depend on your package and permissions.
Getting started
You can open the Fundraising Optimization Guide from the links on the Fundraising Management dashboard or by searching in the Sidebar.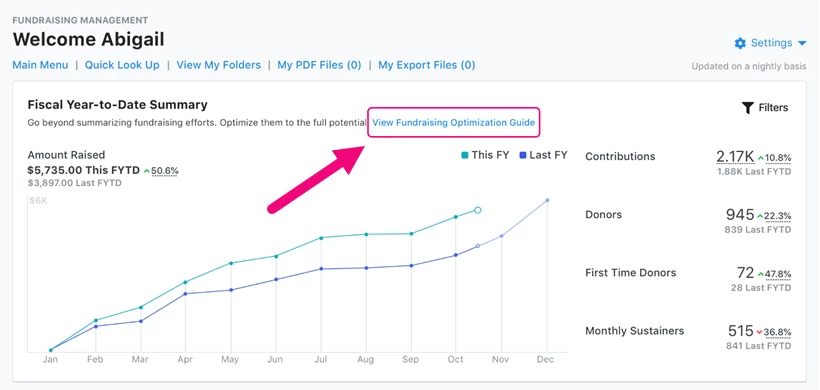
On the Fundraising Optimization Guide page, you’ll see a list of the Opportunities that you can pursue to improve your fundraising efforts. Select one of the guides to see the potential and historical performance cards for that model.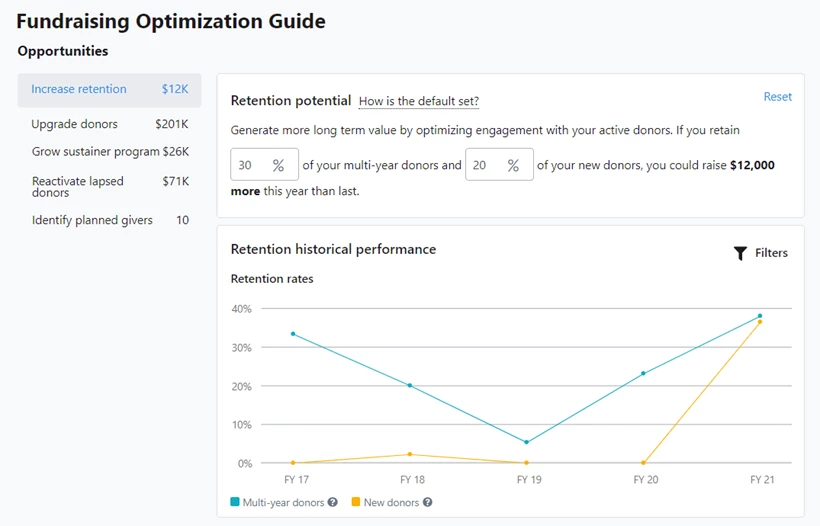
At the bottom of each guide, you will also see a list of action steps you can take, including recommendations for Automations to build or suggestions of donor lists to use. If you have DonorTrends, you will be able to immediately generate these lists.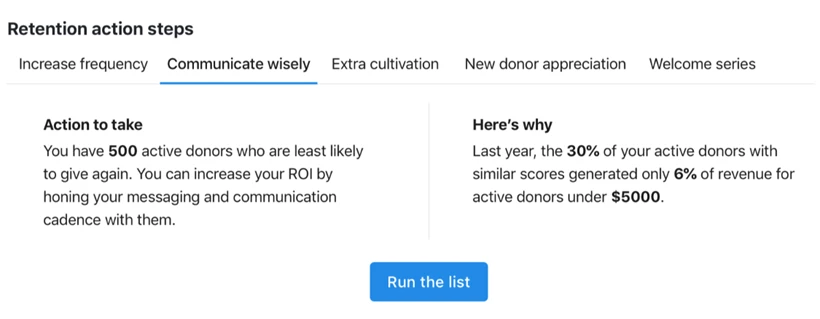
Increasing retention
On the Increase retention page, you will see how much more money you will raise if you have a modest increase (2%) in your multi-year and new donor retention. You can try increasing or decreasing that number to see the result with other scenarios.
You’ll also see a historical performance graph that measures:
-
Multi-year retention: how well you’re doing at getting donors who have given for multiple years to give again
-
New donor retention: how well you’re doing at getting donors who give for the first time in the previous fiscal year to give again
You can filter the graph to show data through the end of each quarter or the full year.
The action steps will give you some specific recommendations that can help you boost retention rates. If you have the DonorTrends predictive analytics package, you will also have access to targeted donor lists to use for those actions.
Upgrading donors
On the Upgrade donors page, you will see the potential results of a modest increase in the count of upgraders and the average upgrade amount on your bottom line. You can increase or decrease those numbers to see the impact of other possible scenarios.
You’ll also see a historical performance graph that measures:
-
The number of upgraders: the number of donors whose total giving in that year was greater than their total giving in the previous year
-
The average upgrade amount: the amount your upgraders increased their giving level
You can filter the graph to show data through the end of each quarter or the full year.
In the action steps, you’ll see suggestions for target lists of donors likely to upgrade and worth your efforts. If you have DonorTrends, you’ll be able to immediately create segmented lists to begin your outreach to this group.
Growing your sustainer program
The Grow sustainer program page helps you identify potential new sustainers and prevent attrition in your program. Sustainers are automatically identified as anyone who has a successful contribution that is an installment of a monthly recurring commitment at any point during the year.
The potential card at the top helps you see the impact that increasing the number of new sustainers and the average monthly gift can have, as well as how an increase or decrease in the number of sustainers leaving the program will affect your revenue.
The historical performance card shows the history of the last four years of the sustainer program, with two graphs that show the counts of new and active sustainers and their average monthly contribution.
The number of sustainers graph includes:
-
New sustainers are donors who become sustainers and stayed through the end of the year
-
Multi-year sustainers are donors who were already sustainers and stay on through the end of the year.
-
Multi-year and New attrition tracks donors who lapse from their sustaining commitments before the end of the year from the two categories.
The Average monthly contribution graph tracks average monthly contributions from active donors by calculating the sum of all successful contributions that were made as monthly recurring contributions for the year and then dividing by the number of months in which those gifts were made.
The Sustainer growth action steps help you identify targets for sustainer invitations and upgrades as well as steps to take to avoid any attrition in your program. These action steps are available for ALL fundraisers, whether you have DonorTrends or not, and will give you a better idea of how the DonorTrends add-on can make it even easier to take immediate action using these predictive models.
Reactivating lapsed donors
The Reactivating lapsed donors page will allow you to better understand how you are doing at bringing back lapsed donors and the impact that reactivation has on your revenue. You’ll see the reactivation potential for how much more money you can raise if you reactivate more donors this year than last year.
The historical performance card includes data from the last four years on anyone who gave in a fiscal year, did not give during the subsequent year, but then reactivated for the following year. You can filter the graph to show data through the end of each quarter or the full year.
The action steps for this model will help you sort donors by their likelihood to reactivate. If you have DonorTrends, you’ll be able to launch these lists immediately and add them to your next reactivation campaign.
Identifying Planned Givers
The Identify planned givers page helps you see how well you are encouraging your donors to become planned givers. You can adjust the numbers in the potential card to predict how generating more requests for information will affect the number of new planned giving commitments made to your organization.
The historical performance card uses the information from your Planned Giving Plans to show a history of the last four years of information request generation and how that measured up against your planned giving commitments.
The action steps help you target donors who you should be reaching out to with more information about planned giving.
Understanding more about the Fundraising Optimization Guide
In the Fundraising Optimization Guide, a donor is defined as any contact or financial household that has made a contribution during the years included in the analysis. Contacts in a financial household are only counted once, even if both members made donations.
Anyone who made an attributed contribution using a donor-advised fund, workplace gift, or family foundation is also counted as a donor, and the donation totals and averages will include these types of gifts.
While the guide can be used at any point in your fundraising efforts, you will probably find it most useful when planning for:
-
A new fiscal year
You can use the Fundraising Optimization Guide to help you examine your past performance and identify action steps to improve future giving. You’ll be able to identify more opportunities that already exist with your current donors and adjust your resource allocation to include these opportunities. You can also adjust some of the variables in the models to forecast different outcomes and see how changes will affect your bottom line.
-
Individual fundraising campaigns
When you are planning for your next renewal or end-of-year campaign, you can use the Fundraising Optimization Guide to help you find new tactics you can use to improve your outcomes. If you have the DonorTrends add-on, you’ll also be able to instantly generate lists that will target the right donors for those asks.