

A graph can be added to any section within a report to help visualize the data within your report columns. Follow the steps listed below to learn how to add a graph to your report.
Note: Report sections may only contain one graph at a time. If you want to use the same data set for multiple graphs, you can copy the report section then add a graph to each new section.
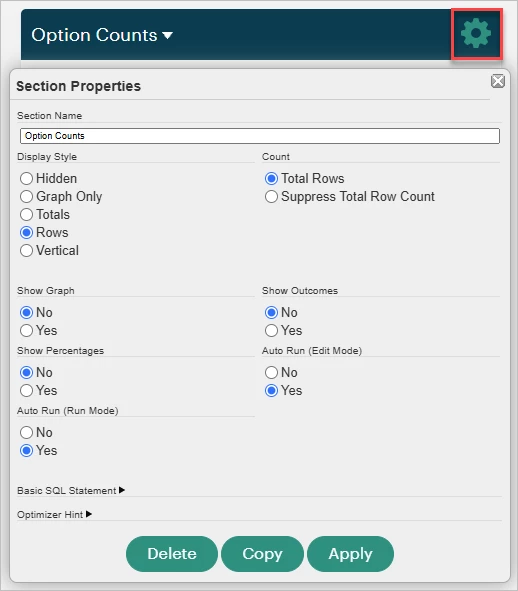
Step 1: Choose a section
Scroll to the report section you want to graph data for, then click the green gear icon next to its header to open its Section Properties.
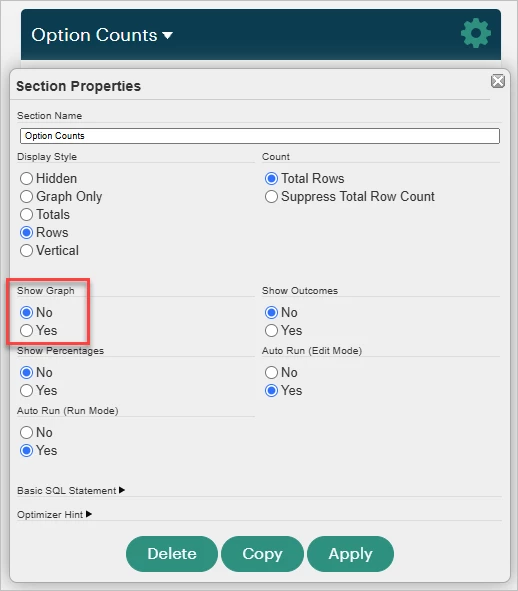
Step 2: Enable graphs
Under 'Show Graph', select Yes.
You'll see a small pop-up message at the top of your page while the report section generates the graph: "Updating Section 'Report Section Name'".

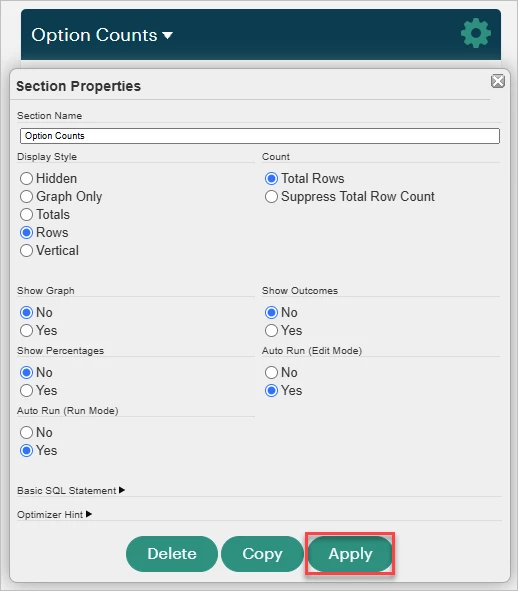
Step 3: Save your changes
Select Apply to close the Section Properties and view the graph.

What else do you need help with?
-
Not what you're looking for? Navigate to overview
How do I add a graph to a report in native reporting? | Where do I find the graph option in a native report? | Why can’t I add a graph to my native report? | How do I choose the type of graph for a native report? | How do I customize a graph in Apricot native reporting? | How do I filter what data appears in a native report graph? | What permissions do I need to add a graph to a native report?