

How does reporting work in Deed Grants?
Learn how Deed Grants reporting helps administrators track grantmaking data and review impact from funded organizations.
Deed Grants includes built-in reporting tools that help you explore your grantmaking data and monitor the outcomes reported by your grantees. This article walks through what each reporting area shows, who can access it, and how to interact with the available features.
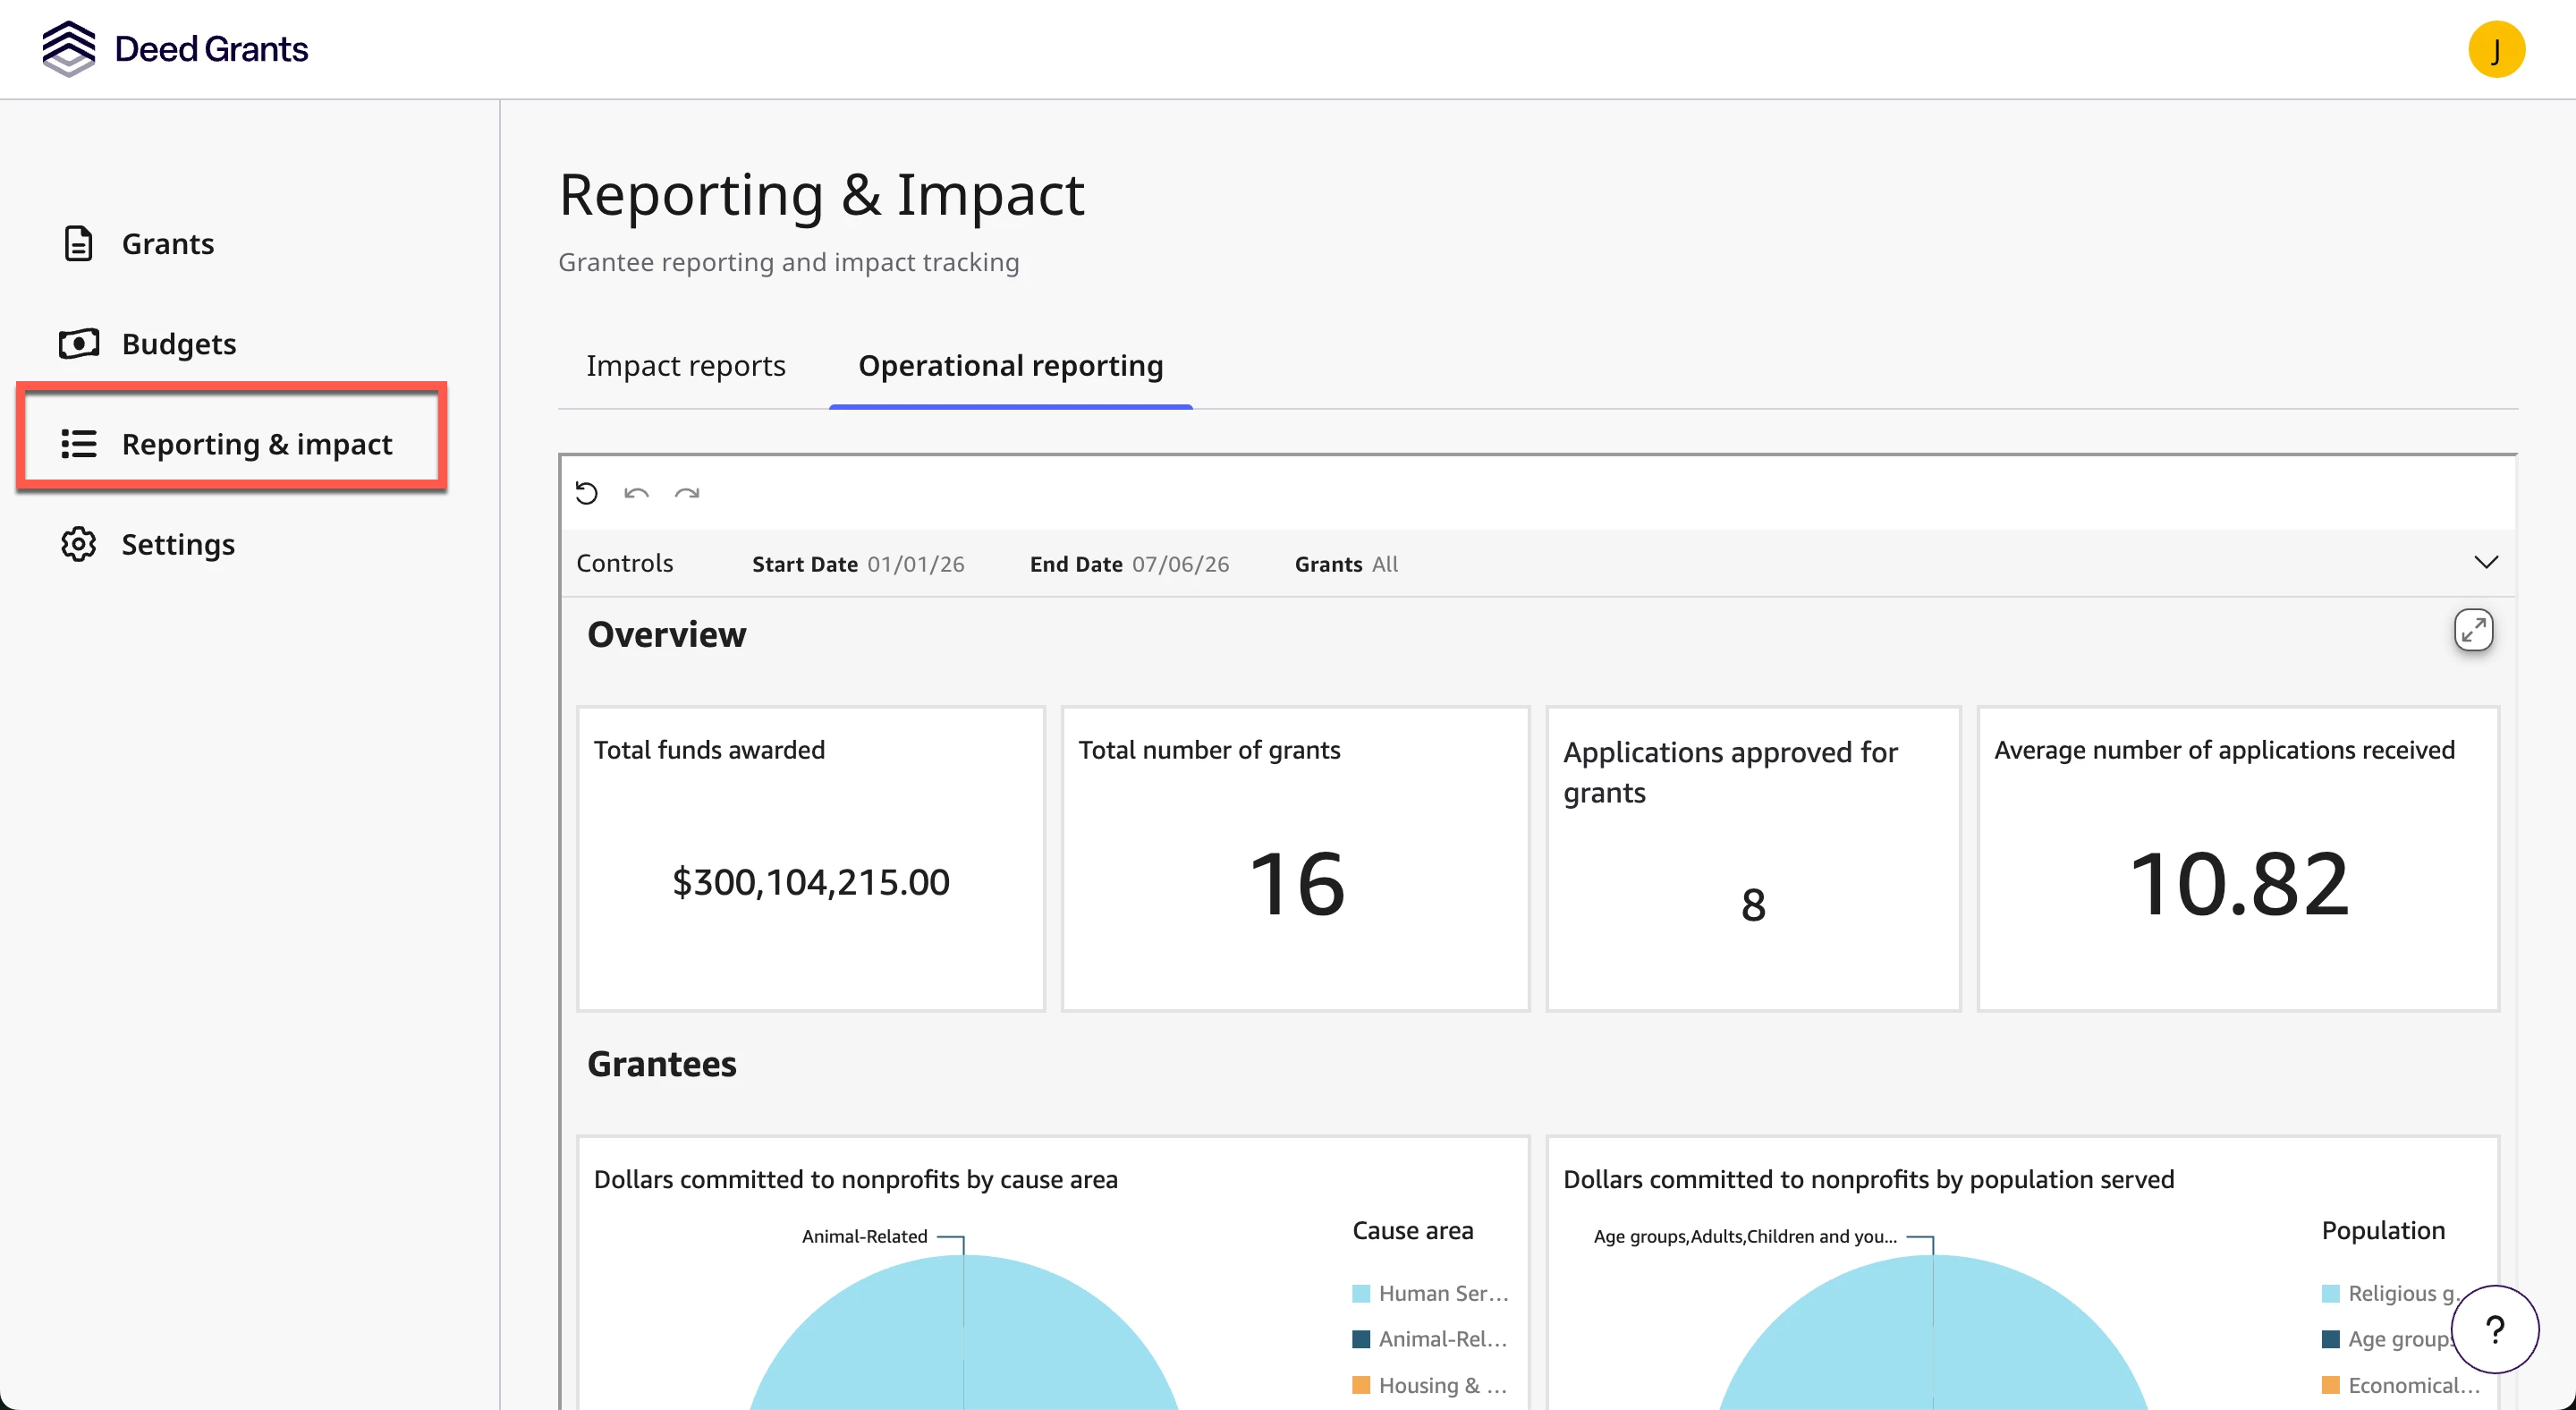
Who Can Access Reporting
The reporting dashboard is available to administrators only and can be accessed via the left navigation panel. Admins can access two types of reporting: the Operational Reporting dashboard and Impact Reports.
What the Operational Reporting Dashboard Shows
The operational reporting dashboard presents key metrics and charts related to your grants and grantees, such as:
- Total funds awarded
- Total number of grants
- Total number of applications approved for grants
- Average number of applicants
- Funding distribution by cause area, population served, and location for applicants and grantees
- Number of applications received per grant by cause area, population served, and location
- Number of applications in each status (Received, In Review, Approved, Declined)
Filtering the Data
You can refine what you see on the reporting dashboard using filters at the top of the page.
Filter by Date
- Date filters are based on the application submission date.
- Use this filter to focus on a specific reporting period or timeframe.
- The date filter is required for all searches. Broaden the date filter to capture all data.
Filter by Grant
- You can choose to include all grants or narrow the view to one or more specific grants.
- Use the Select all or Deselect all options to quickly adjust your selection.
Filters apply across the entire dashboard, so all visualizations update together.
Interacting with Visualizations
Each chart on the reporting dashboard includes interactive tools to help you explore the data.
Hover for Details
- Hover over any section of a chart to see additional information, such as exact values or percentages.
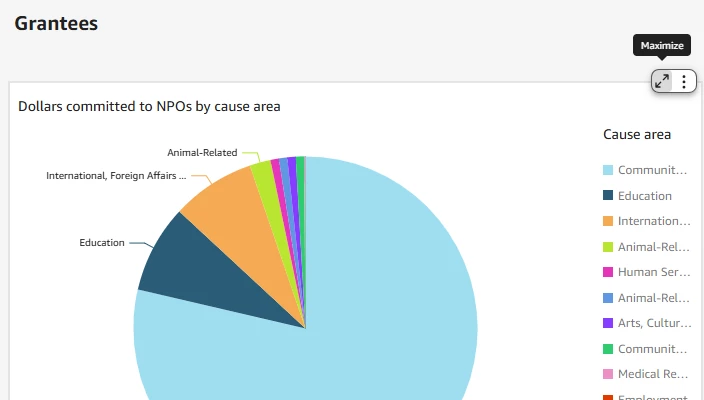
Expand a Chart
- Select Maximize to expand a visualization to full width.
- This is helpful when you want a closer look at a specific chart.
Viewing and Exporting Data
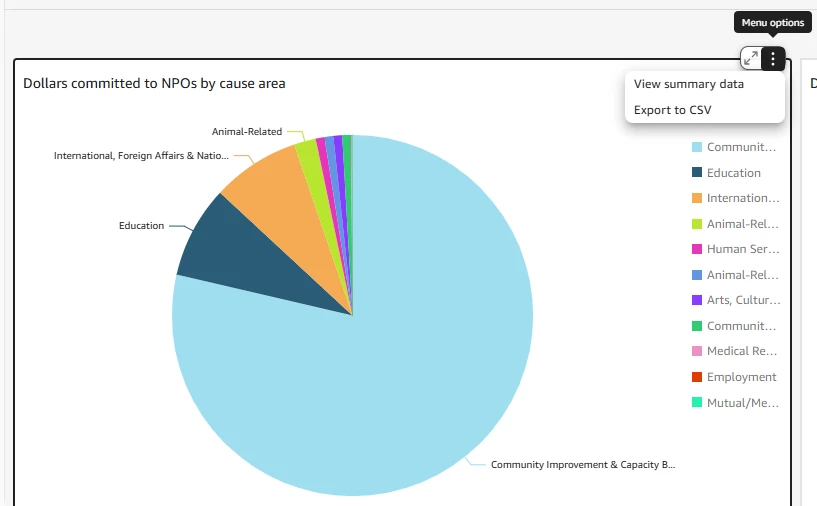
Each visualization includes a menu (three dots in the top corner) with additional options:
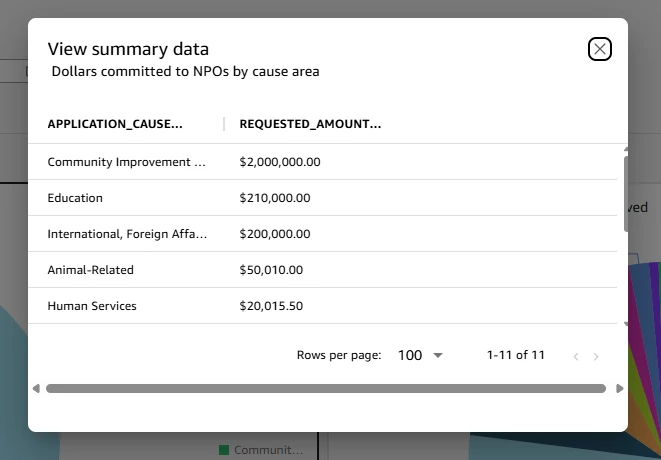
- View summary data: Opens a table showing the raw data behind the chart in a pop-up window.
- Export to CSV: Downloads the data so you can analyze it further or share it outside of Bonterra Grantmaker.
These options make it easy to move from high-level insights to detailed data when needed.
Tips for Getting the Most Value
- Start with broad filters to understand overall trends, then narrow your view for deeper analysis.
- Use the maximize feature when reviewing data during presentations or meetings.
- Export data when you need to combine dashboard insights with external reporting or analysis.
The reporting dashboard is a powerful way to quickly understand your grantmaking activity and make more informed decisions.
Impact Reports
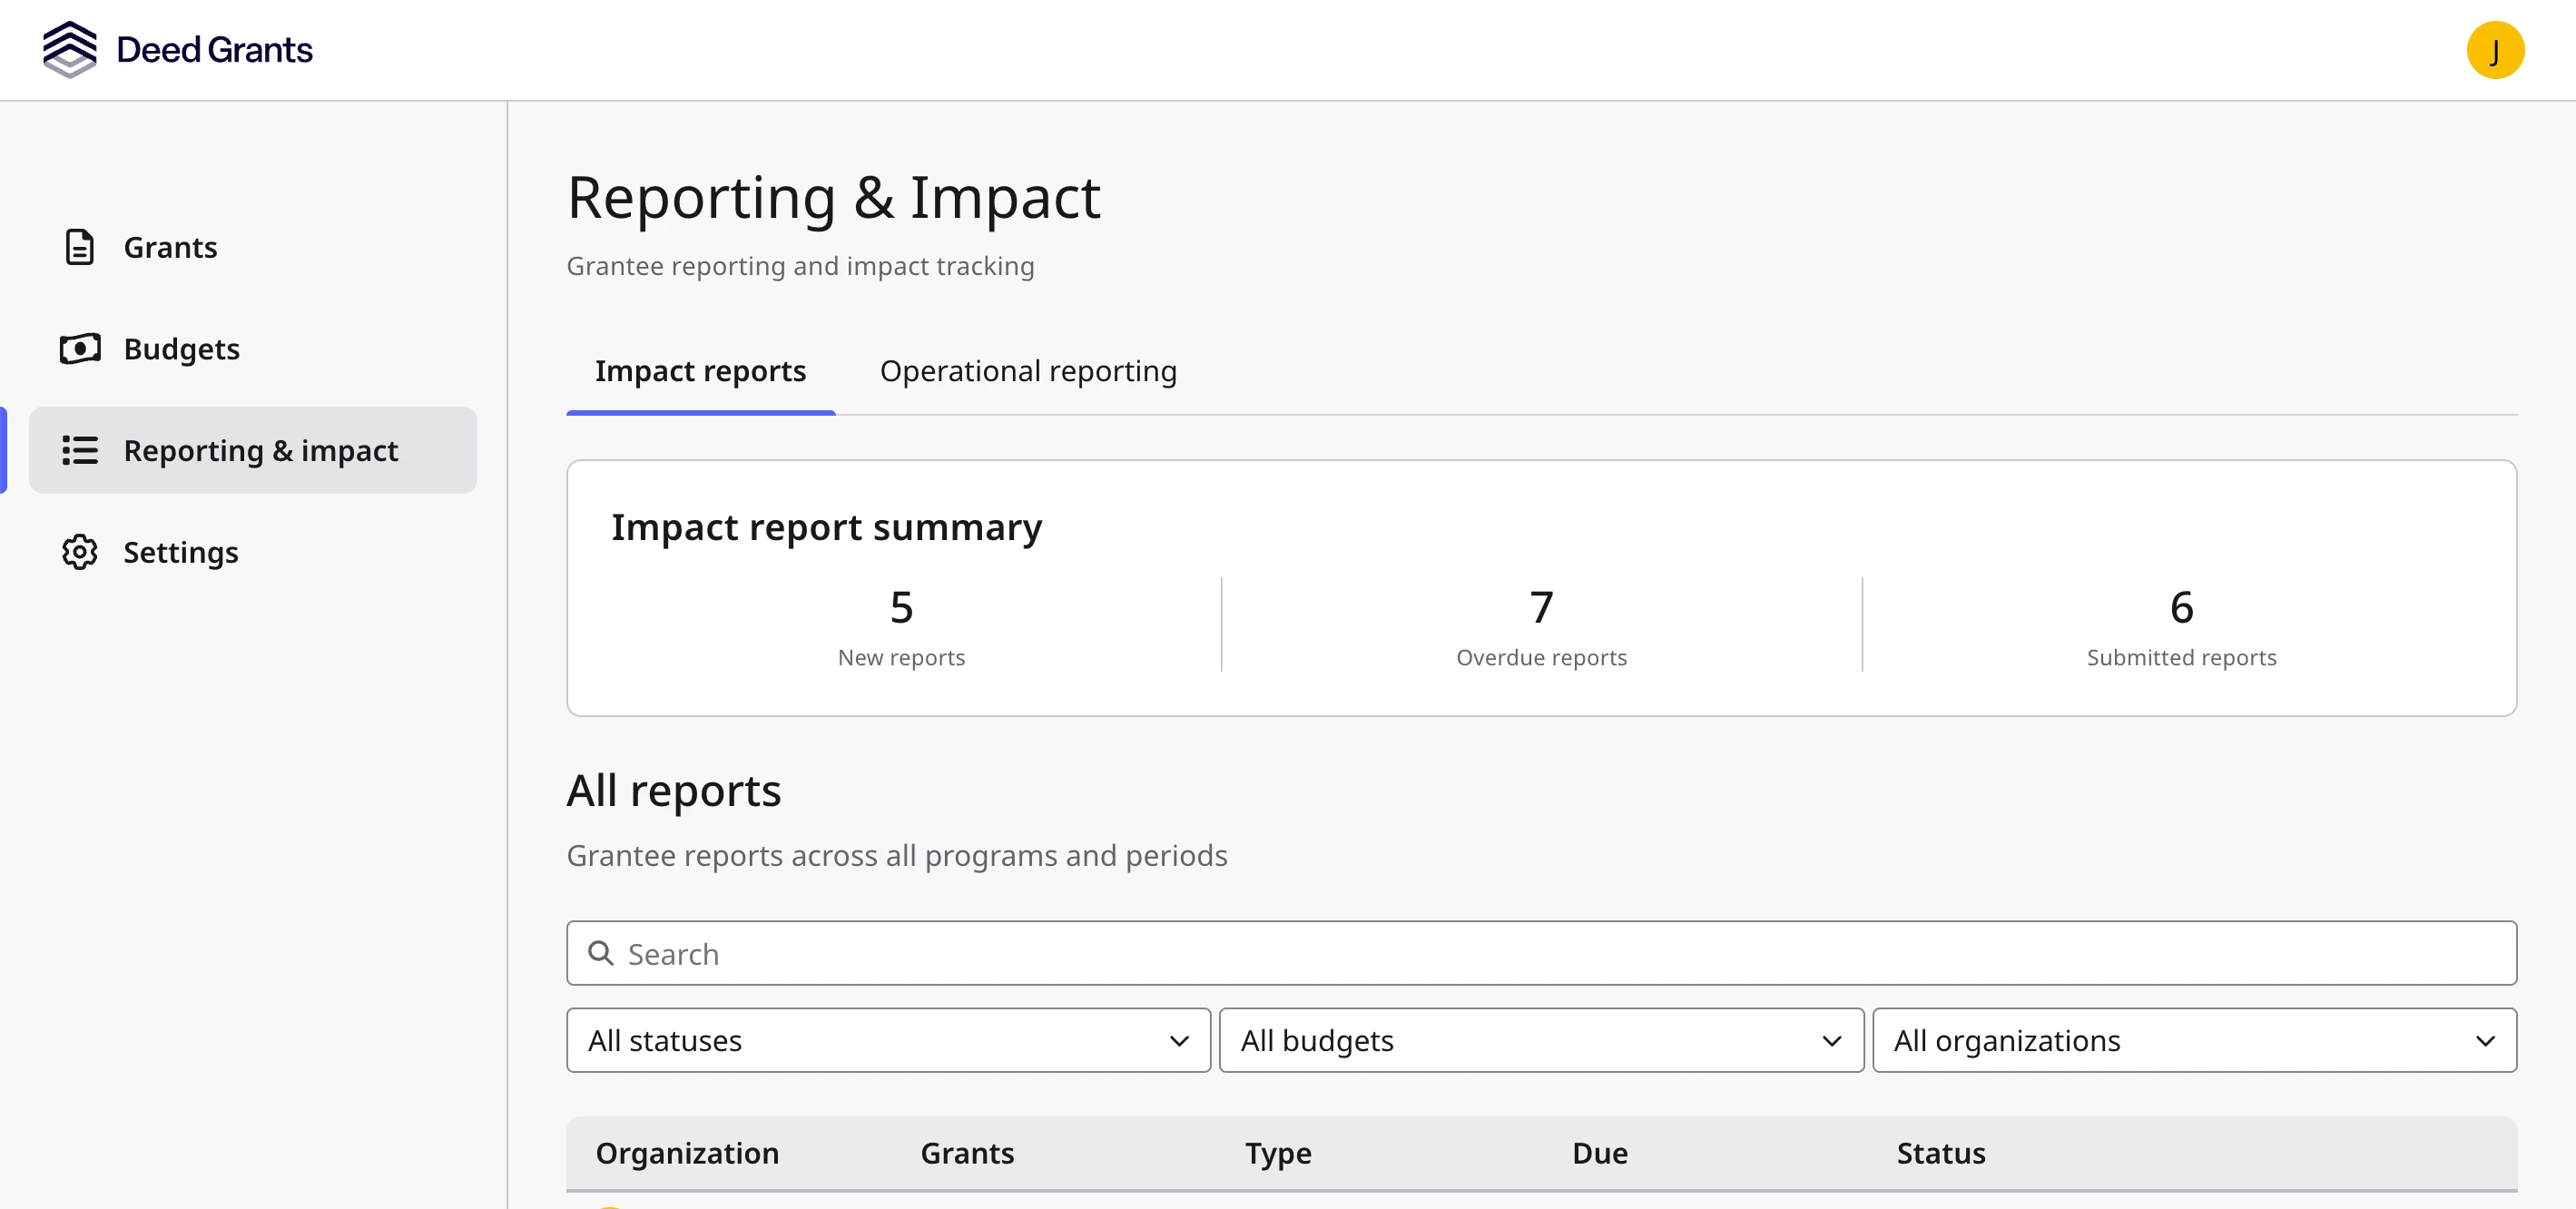
Impact reports allow you to view outcome reports submitted directly by your grantee organizations. The dashboard at the top of the Impact Reports section provides a quick summary of new reports, submitted reports, and any reports that are overdue.
Finding and Filtering Impact Reports
You can filter impact reports by status, budget, and organization, or search for a specific grant to locate the report you need.
Assigning an Impact Report to an Organization
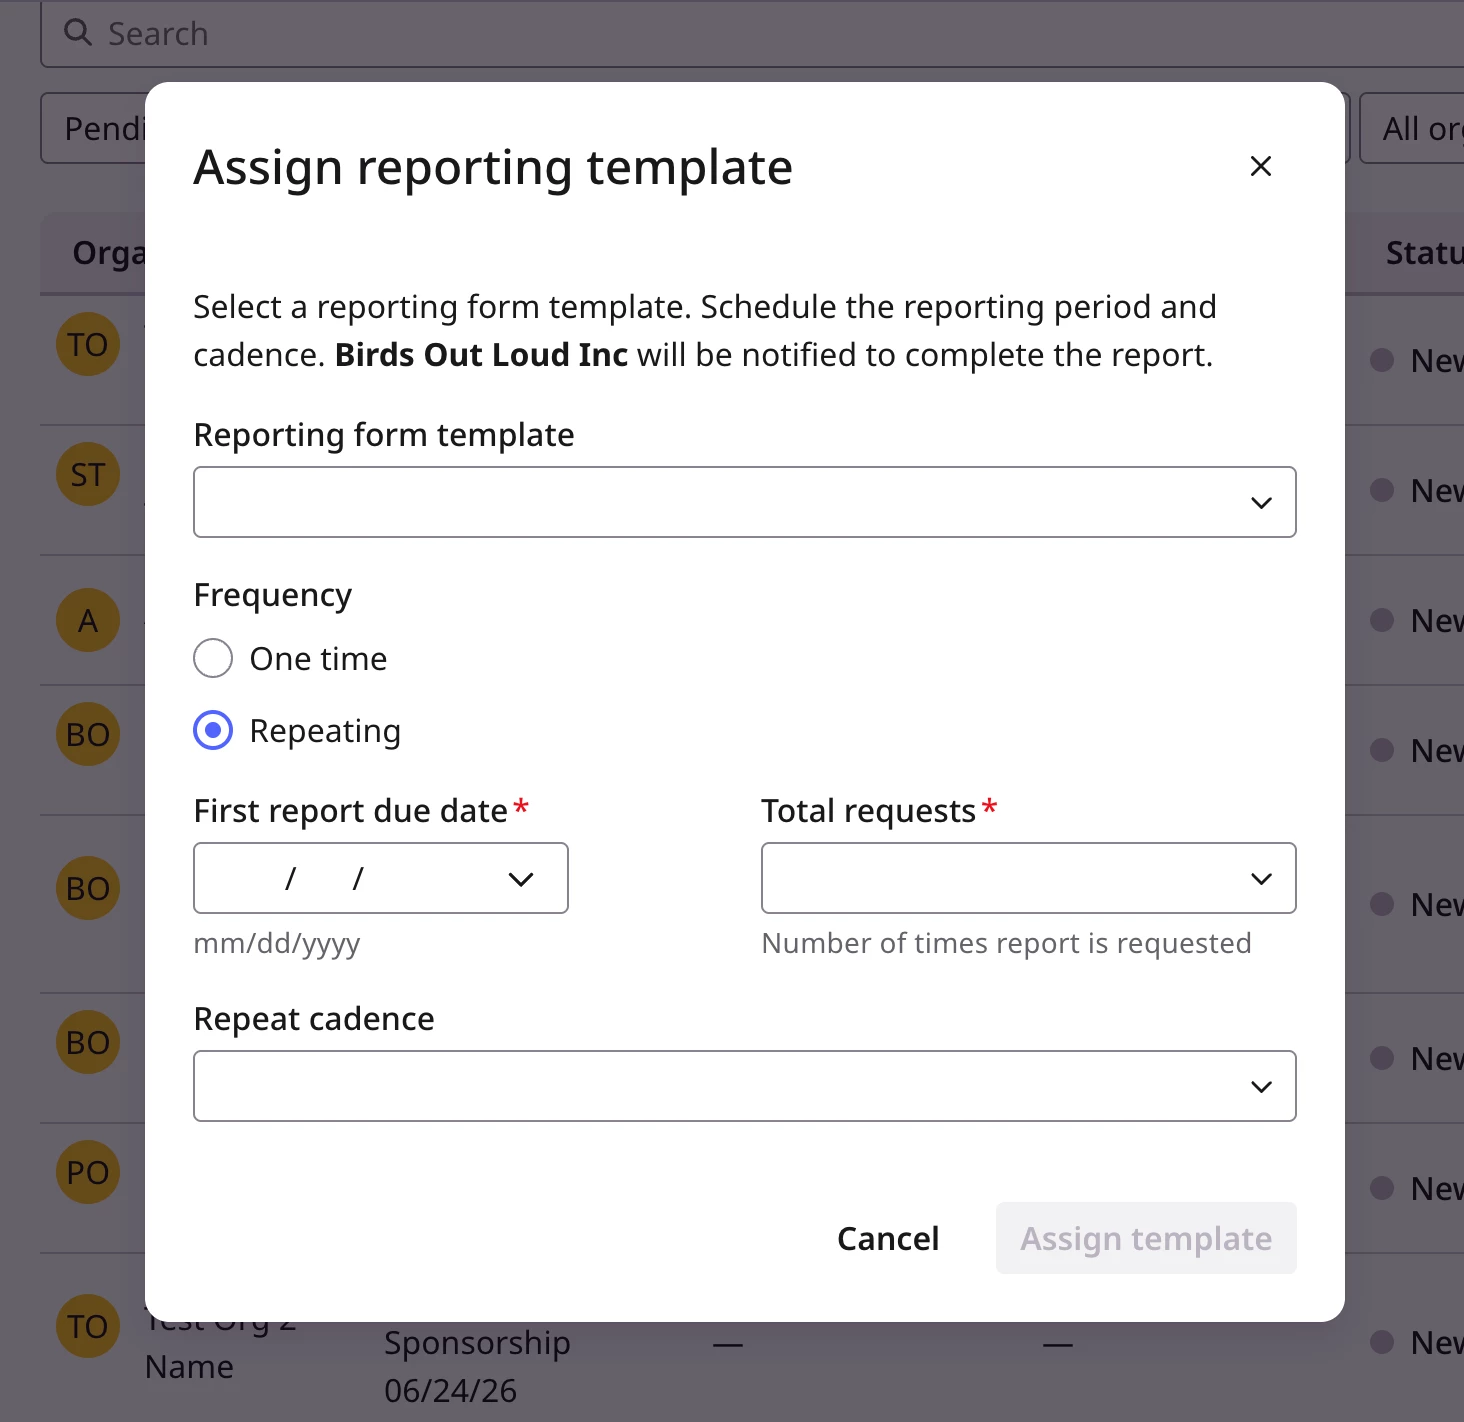
To request an impact report from a grantee, locate the appropriate organization, select the ellipsis on the right, and choose Assign reporting template. This applies a set of questions you would like the nonprofit to respond to. From here, you can configure:
- Frequency
- First report due date
- Total number of reports requested
- Repeat cadence
Reviewing a Submitted Report
Once an impact report has been submitted, select the organization name to open the report. From there you can:
- Mark as reviewed to record that the report has been evaluated
- Use the ellipsis to Export as PDF
Reviewed reports remain accessible and exportable after they have been marked as reviewed.
Sending a Reminder for Overdue Reports
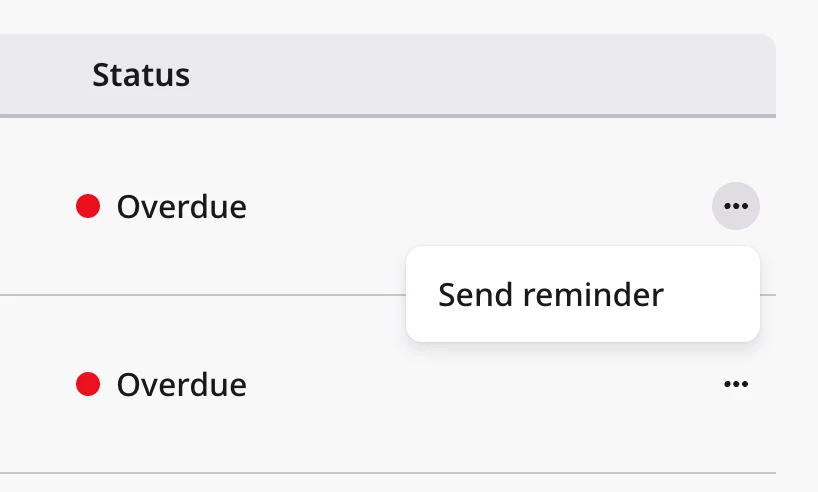
If an organization has an overdue impact report, select the ellipsis beside their name and choose Send reminder to notify the organization of their overdue status.
Tips for Getting the Most Value
- Export operational data to CSV or impact reports to PDF when you need to share insights outside of Deed Grants.
- Use impact reports to close the loop on funded grants — understanding outcomes helps inform future funding decisions and strengthens your organization's grantmaking strategy.
Deed Grants reporting gives administrators a complete picture of both grantmaking activity and the real-world impact of funded work, supporting more informed decisions at every stage of the grant lifecycle.