

Overview
Dashboards are easy-to-use reporting tools that empower your organization with prescriptive views into your performance across key areas, surfacing the most relevant data for your users and allowing you to make informed decisions on where to act.
Navigating to Dashboards
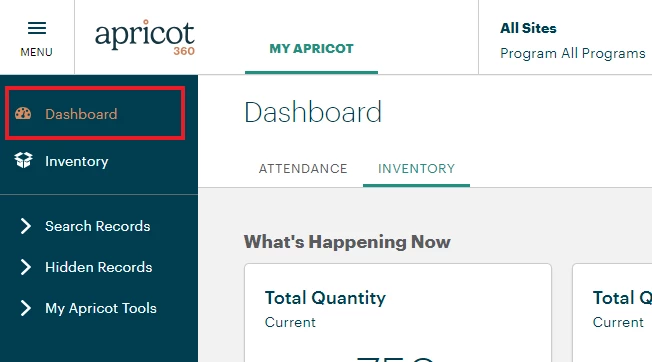
Select Dashboard on the navigation menu at the top-left of your Apricot page.
Select Available Dashboards
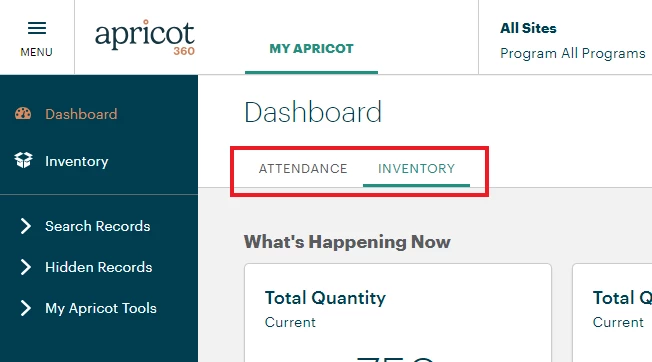
A variety of dashboards are available to select depending on your organization's location and access.
Anatomy of a Dashboard
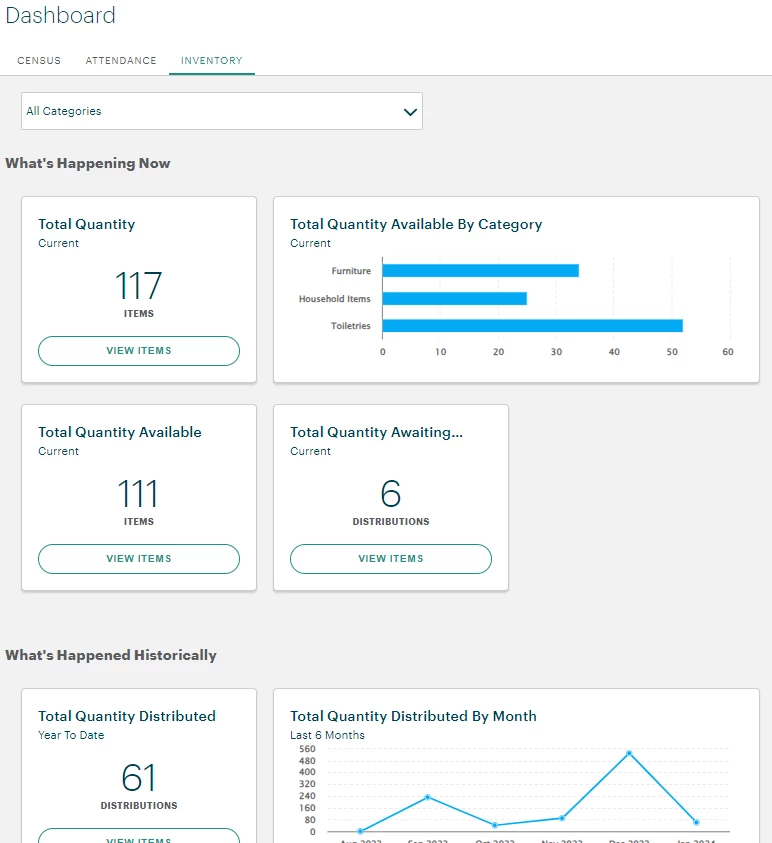
Dashboards are a collection of several insights, each presenting a specific set of data with a title, subtitle and chart. Chart types include headline insights, bar charts, line charts, and more. The filters on the dashboard will update all insights with new criteria.
Filtering
Filtering on a dashboard allows for refining your analysis with specific subsets of data. When a filter dropdown value is changed, each insight will be refreshed to reflect that criteria.
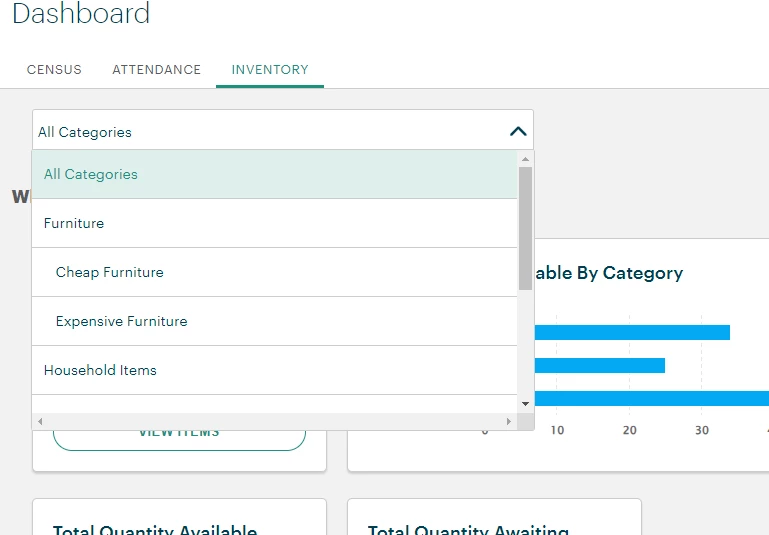
Chart Types
Dashboards have several types of charts. Each has a different way to visualize data based on the volume of data, purpose of chart, and variety of the values.
-
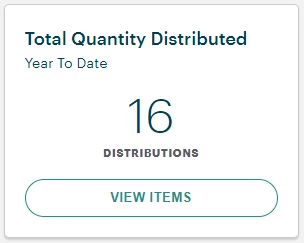
Headline - The headline chart is useful for highlighting a single number in order to emphasize a key performance indicator.
-
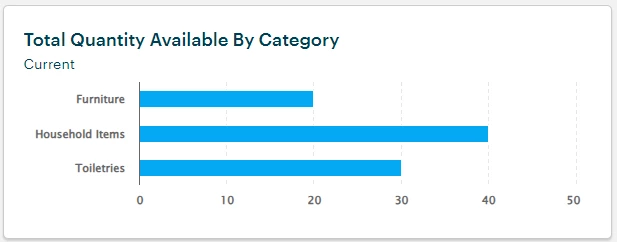
Bar - The bar chart allows for comparison of data when there are few categories to compare but many items.
-
Line - The line chart allows for comparison and analysis of trends in a data point over time.

Interacting with Insights
Users can click on any insight to drill down into the underlying data. You may navigate through the detailed list of records by paging or scrolling, ensuring a seamless experience.
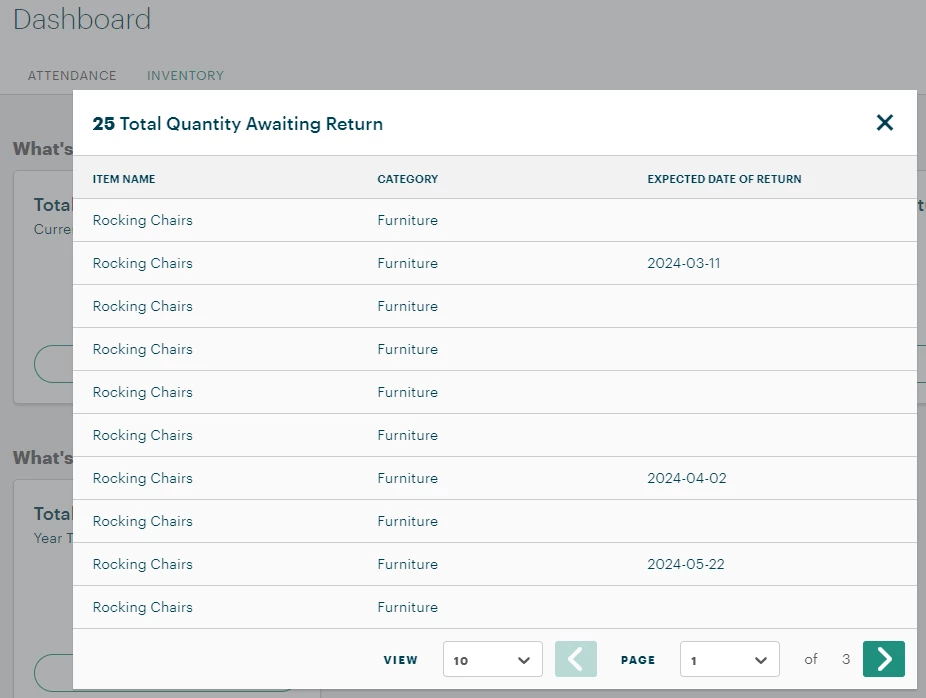
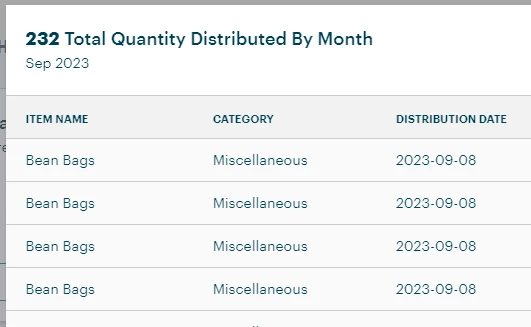
When you click on a headline chart, you will see all records from the chart. However, for charts that group data (such as a bar chart or line chart), drilling in will show a filtered subset of data.
For example, view the the line chart below.
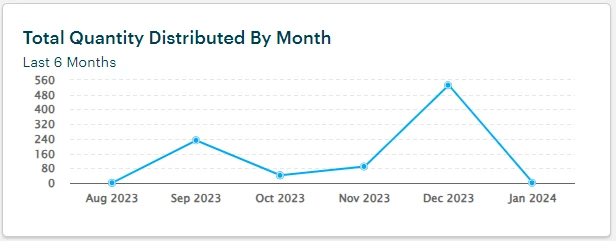
Clicking on the data point for "Sep 2023" will only show distributions from that month in the drill-down modal.
What Are Dashboards in Apricot? | How Do I Use Dashboards in Apricot? | Where Do I Find Dashboards in Apricot? | What Information Do Dashboards Show in Apricot? | Why Can’t I See a Dashboard in Apricot? | How Do I Customize Dashboards in Apricot? | How Do I Interpret Dashboard Charts and Metrics in Apricot?