

Overview
We have updated the Inventory Dashboard to introduce two new powerful additions to our tool: bar charts and line charts. Continue reading to learn more about these enhancements!
Click here to review our previous release notes for the Inventory Dashboard tool, which includes how to access the Inventory Dashboard and other available insights into your inventory status and distributions.
Enhancements
Bar charts
-
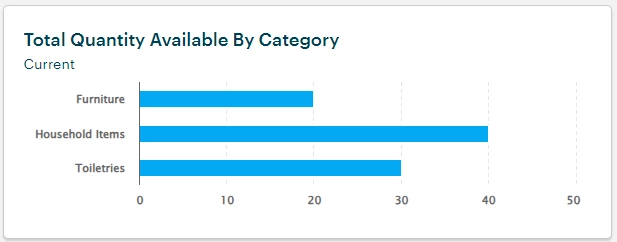
This chart shows the Total Quantity Available grouped by the items' top-level categories, offering a comprehensive view of your inventory distribution.
Line charts
-
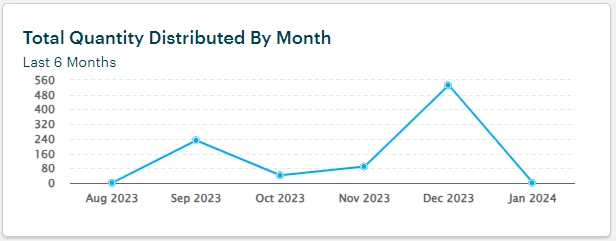
This chart tracks the Total Quantity of item distribution over the last 6 months, providing valuable insights into your inventory trends.
Additional Information
To learn more about the Dashboards feature in Apricot, click here.