

Registration Grids allow users to create multiple Tier 2 records for multiple Tier 1 records at the same time. To learn more about registration grids, click here. Apricot's Report Builder allows you to build a report to gather insights on your classes and participants, including attendance.
Follow the steps listed below to learn how to report on registration grids.
Step 1: Establish your root form
There are three forms used in every registration grid, including:
-
A Tier 1 Class or Event form
-
A Tier 1 Participant or Student form
-
A Tier 2 Attendance form (connected to the Participant form)
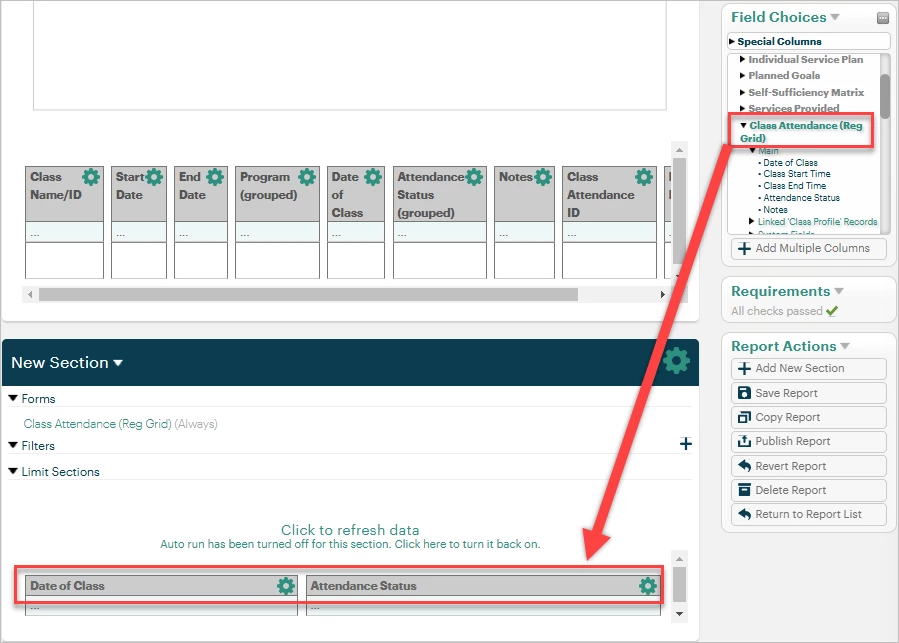
Typically, a Tier 1 form is used as the root form of a native report. However, when reporting on registration grids, the Attendance form must be used as the root form of the section. This ensures there is no duplication of rows within your data set. To learn more about root forms, click here.
In your blank report section, bring in at least one field from the Tier 2 Attendance form to establish it as the root form. You can include the date of the class and the attendance status, for example.
Step 2: Establish linking relationships
Next, add your desired fields from the Tier 1 Participant and Tier 1 Class forms. We added participants' Record IDs and the Class Name field. Under 'Forms' at the top of your report section, the Class form should be indented under the Participant form (not inline with it). If it's not, click the Class form name to open its properties.
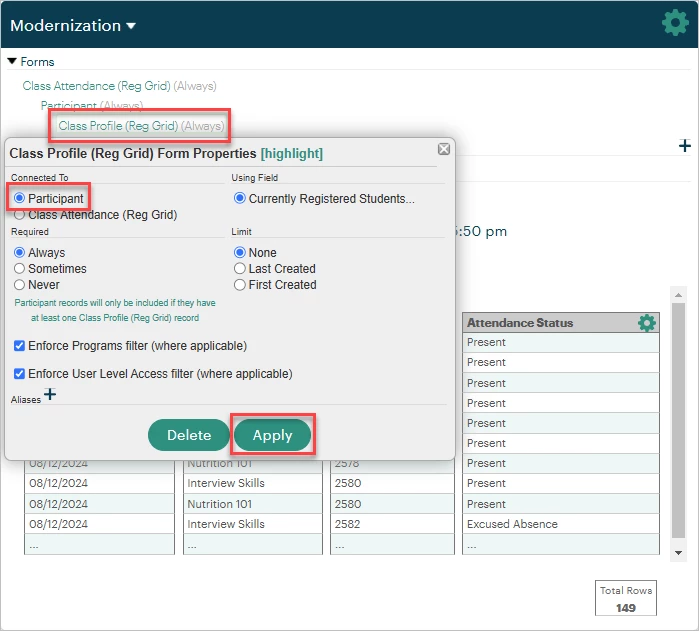
Select the Participant form under 'Connected To' and make sure the correct linking field is selected to the right if there is more than one existing linking field in the form. Click Apply to save any changes.
Step 3: Build out the report
From here, you can use filters and groupings to narrow down your data set. We filtered our example report for a specific class and grouped the data by Attendance Status (ex. Present, Tardy, Excused Absence).
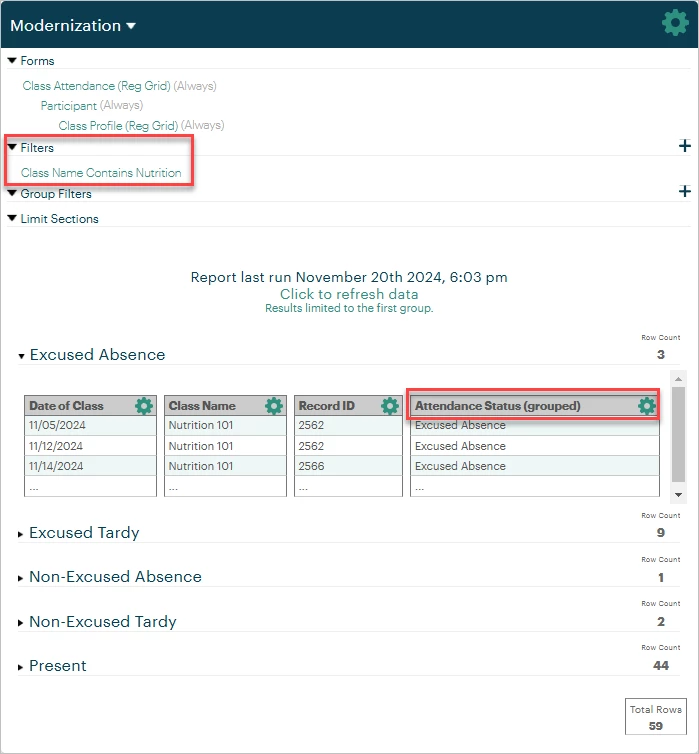
Be sure to save your report often and publish from the Report Actions palette to confirm your changes.
Step 4 (optional): Graph your report
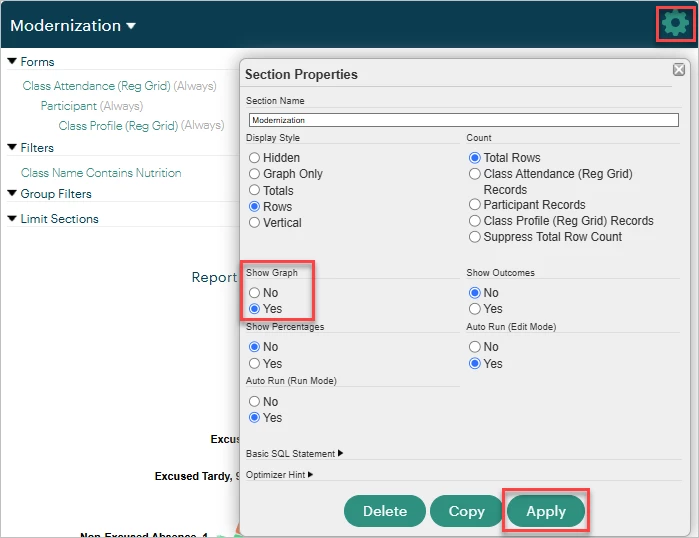
You may choose to add a graph to your report section in the Section Properties to display your grouping summaries. To learn more about report graphs, click here.
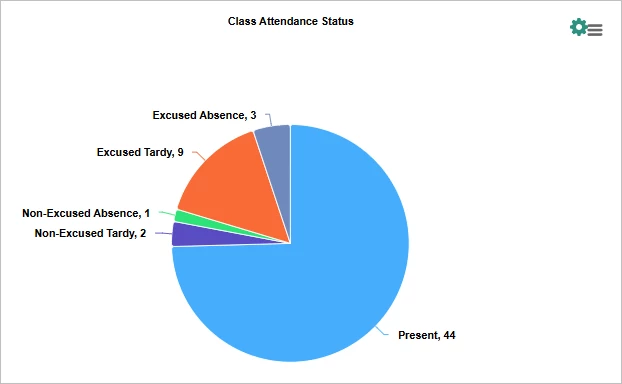
Click the green gear icon for the section, select Yes under 'Show Graph' then apply to generate the graph.
Then click the green gear icon next to the graph to choose your graph type and other settings. In our example, we created a pie graph to visualize and compare our class attendance.
What else do you need help with?
-
Not what you're looking for? Navigate to overview
How do I report on attendance using registration grids in Apricot? | What root form should I use for a registration grid report? | Why am I seeing duplicate rows in my registration grid report? | How do I link Participant and Class forms in a report? | How do I group attendance by status in a native report? | Can I create a graph for a registration grid report? | How do I filter a report for a specific class or event?